Introducing the Dashboard: Monitor Your GPU Workloads at a Glance

Until now, there was no single place to see whether your GPU workloads were running as expected — or whether your organization's GPU budget was being used efficiently. We built the Dashboard to change that.
TL;DR
- Home Dashboard is now live — see all your active workloads, GPU usage, and spend rate in one place
- Org Dashboard gives admins org-wide visibility into GPU utilization, team-level spend, and idle workloads
- Workspace Metrics now shows VRAM usage and GPU temperature
Background
GPU compute is expensive. But knowing how well it's actually being used has always required workarounds.
Individual users had to open each workspace one by one, check logs, or run low-level tools like nvidia-smi to understand what their GPU was doing. Questions like "Is my training job actually computing anything?" or "Am I about to run out of VRAM?" had no easy answer from the platform.
For organization admins, the blind spot was even larger. There was no way to see GPU usage at an organizational level — no breakdown by team or user, no sense of how much was being spent in real time, and no signal when resources were sitting idle. Making informed decisions about resource allocation meant relying on manual check-ins or out-of-band tooling.
We heard this repeatedly in interviews with users across academia and industry: a dashboard is table stakes for a paid GPU platform. The Dashboard is our answer to both problems.
What's New
Home Dashboard — For Individual Users
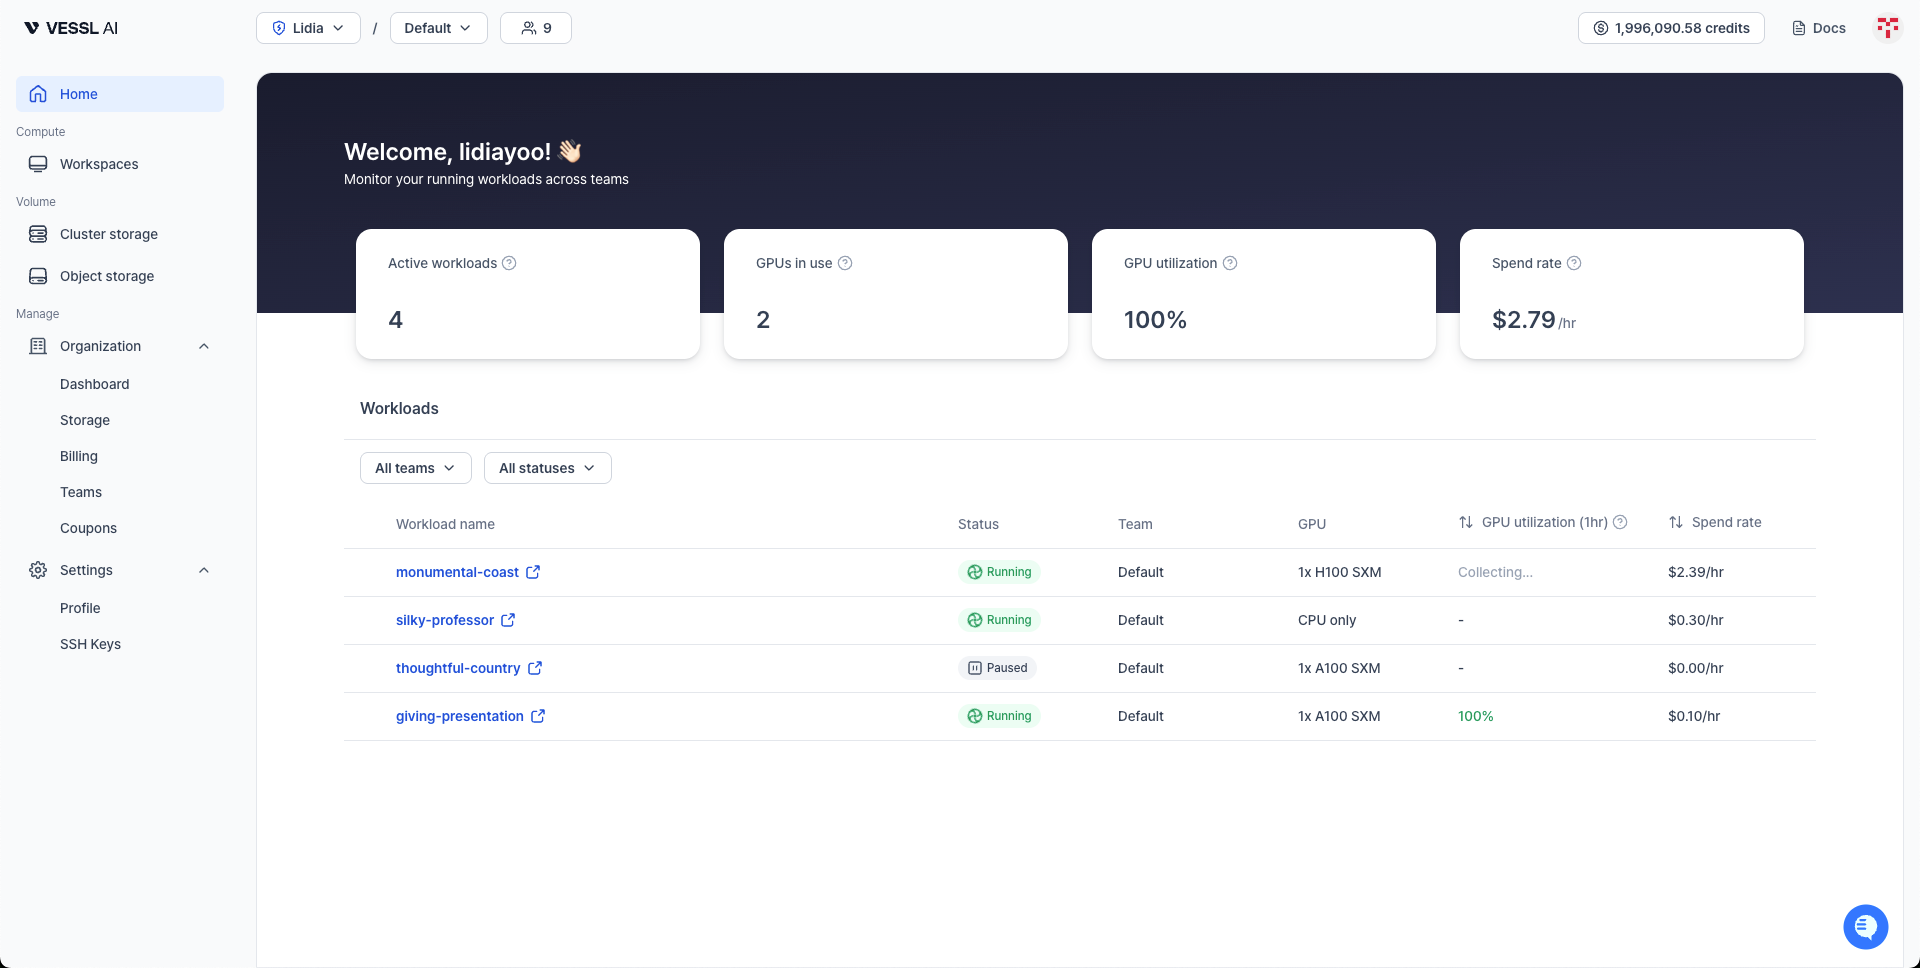
The Home Dashboard is the first thing you see when you log in. It answers the question: "What are my workloads doing right now?"
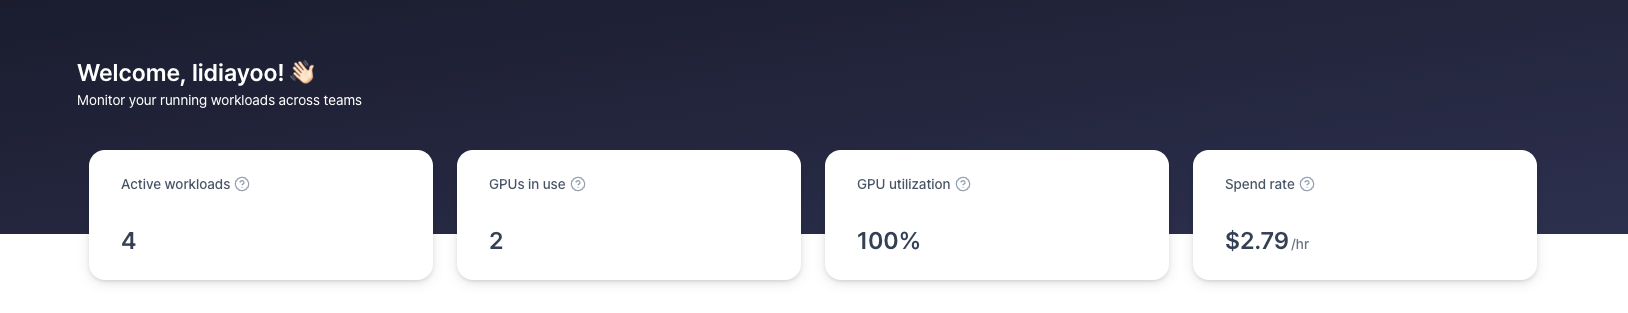
Summary Cards
At the top of the page, four cards give you a quick health check:
- Active Workloads — Total number of your workloads excluding terminated ones (across all teams)
- GPUs in Use — How many GPUs are allocated to your workloads right now
- GPU Utilization — GPU-weighted average utilization across your running workspaces (1hr avg)
- Spend Rate — How much you're spending per hour, right now (e.g.,
$21.85/hr)
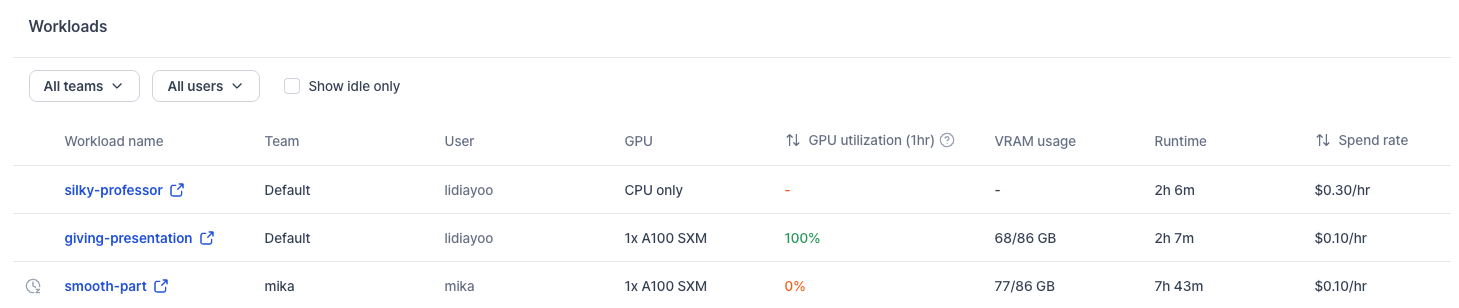
Workloads Table
Below the summary, your workloads are listed in a single table. Use the All teams and All statuses filters at the top to narrow down the list.
Each row shows:
- Workload Name — Click to go to the workspace detail page. Under-utilized workloads are visually flagged.
- Status — Running, Stopped, Paused, Failed, etc.
- Team — Which team this workload belongs to
- GPU — Type and count (e.g.,
1x A100 GPU) orCPU only - GPU Utilization (1hr) — Average GPU utilization over the last hour
- Spend Rate — Cost per hour for this workload
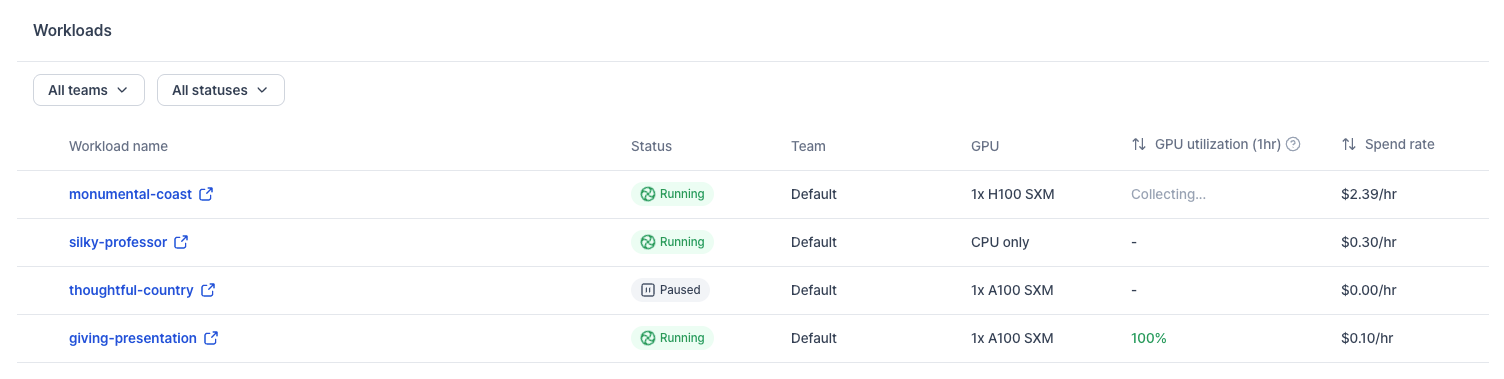
Under-utilization Alert
When a workload has been running with low GPU utilization for 1hr, it's visually flagged in the table.

Org Dashboard — For Organization Admins
The Org Dashboard is accessible from Manage > Organization > Dashboard and is only visible to org admins. It answers: "How is our organization using GPU resources, and where is our budget going?"
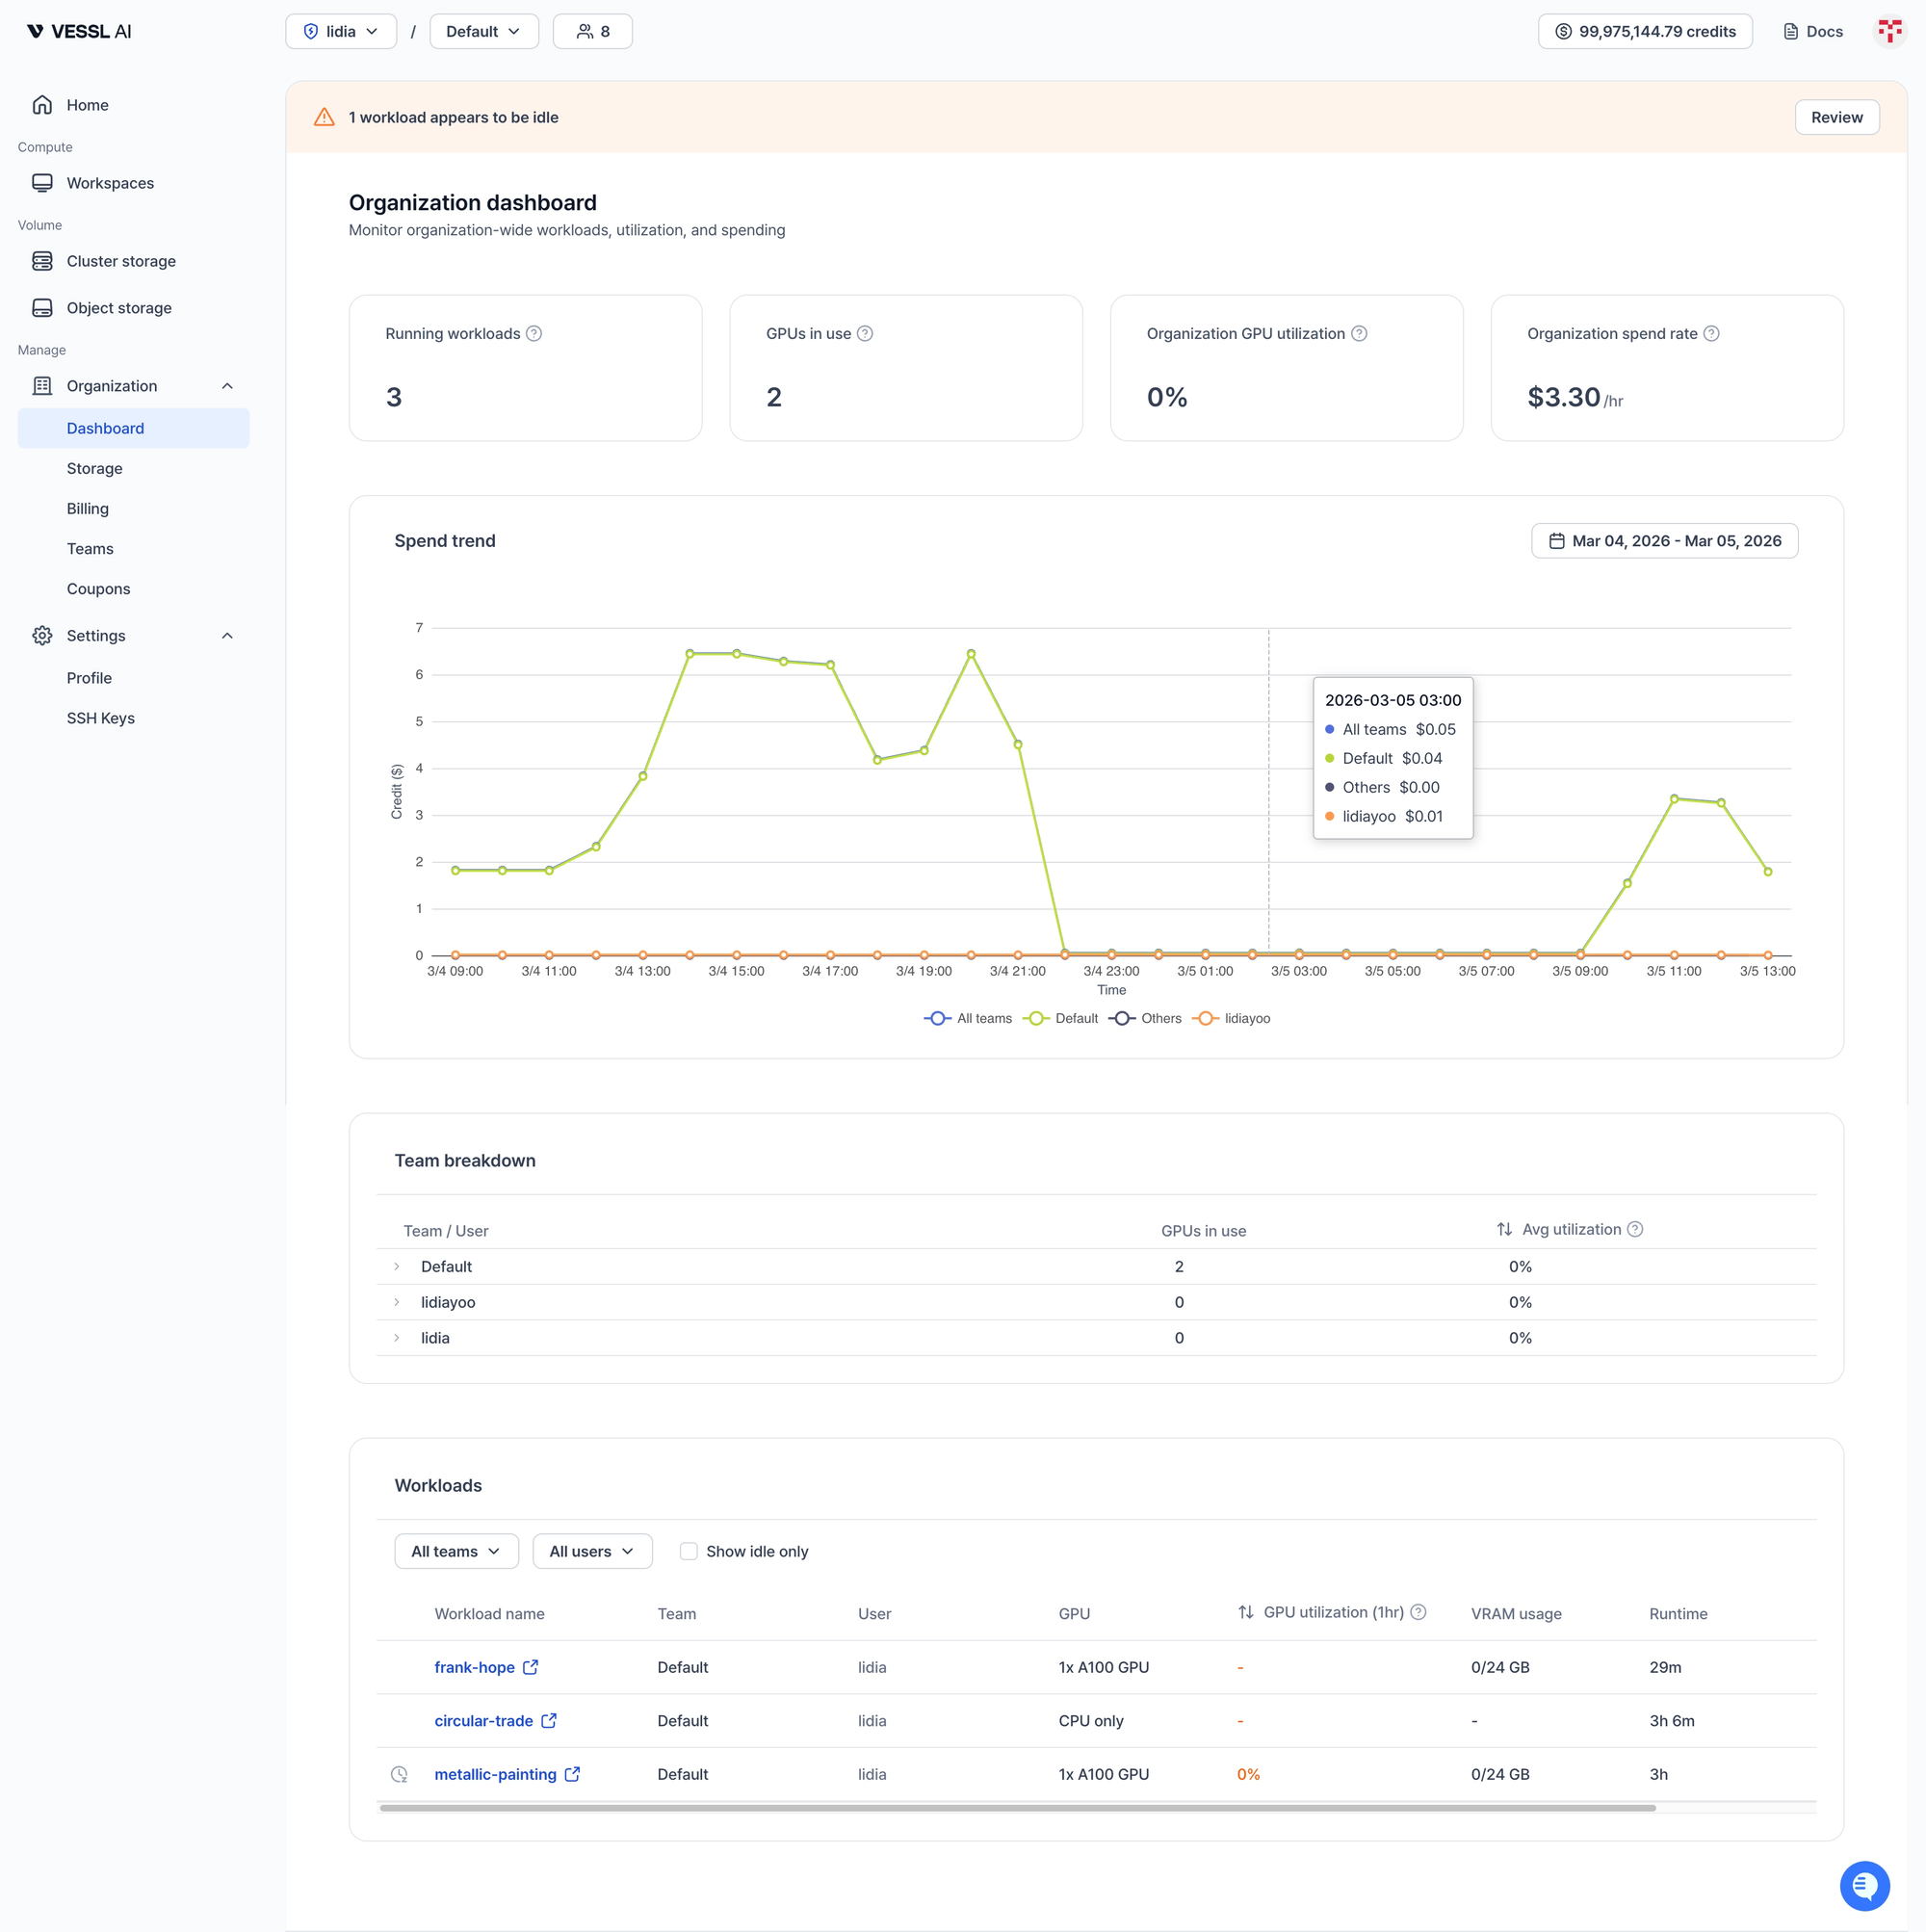
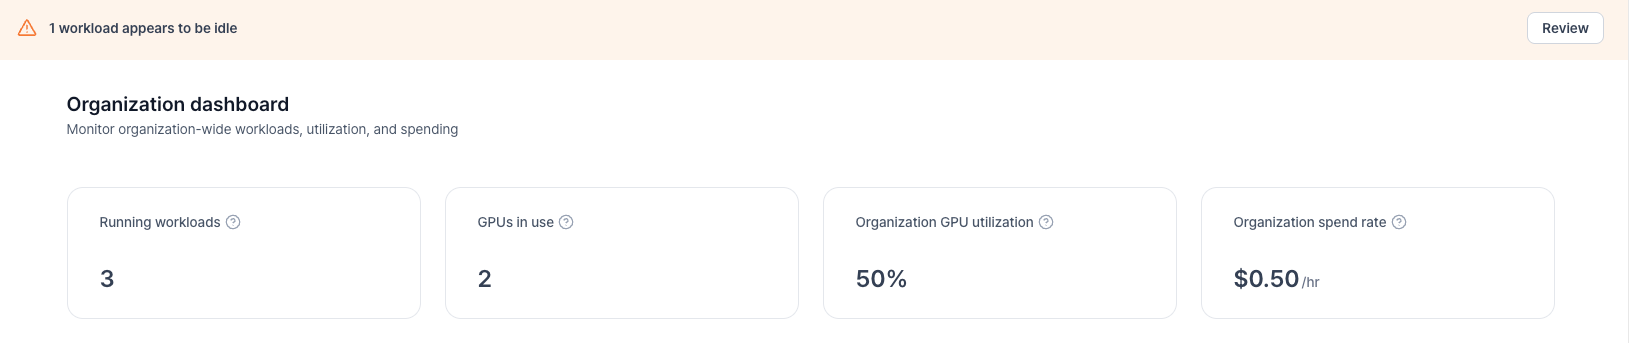
Idle Workload Banner
If any workloads have had 0% GPU utilization for the past 3 hours, a banner appears at the top of the page:
Click Review to jump to the filtered workload list showing idle workloads only.

Summary Cards
- Running Workloads — Total active workloads across the entire organization
- GPUs in Use — Sum of all GPUs currently allocated
- Organization GPU Utilization — Weighted average GPU utilization across all workloads (1hr avg, weighted by GPU count)
- Organization Spend Rate — Total hourly cost for the organization
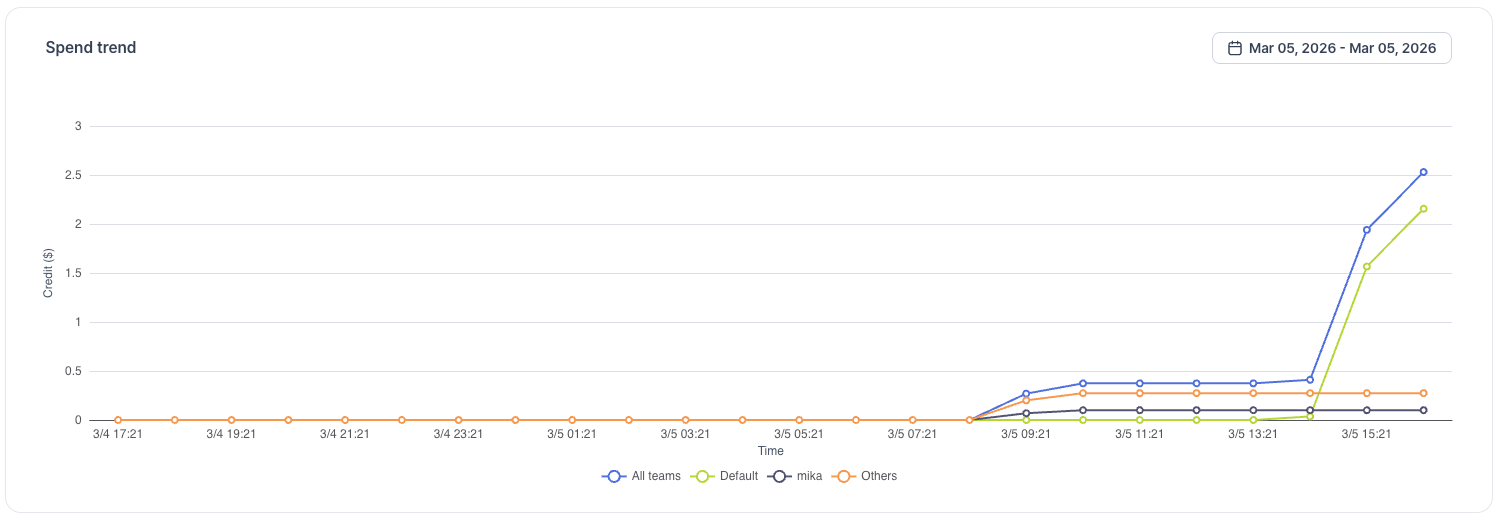
Spend Trend Chart
The spend trend chart shows your organization's credit usage over time, broken down by team. Each team appears as its own line, alongside an "All teams" aggregate line, so you can see exactly where spend is coming from.
Use the date range picker to zoom into a specific window.
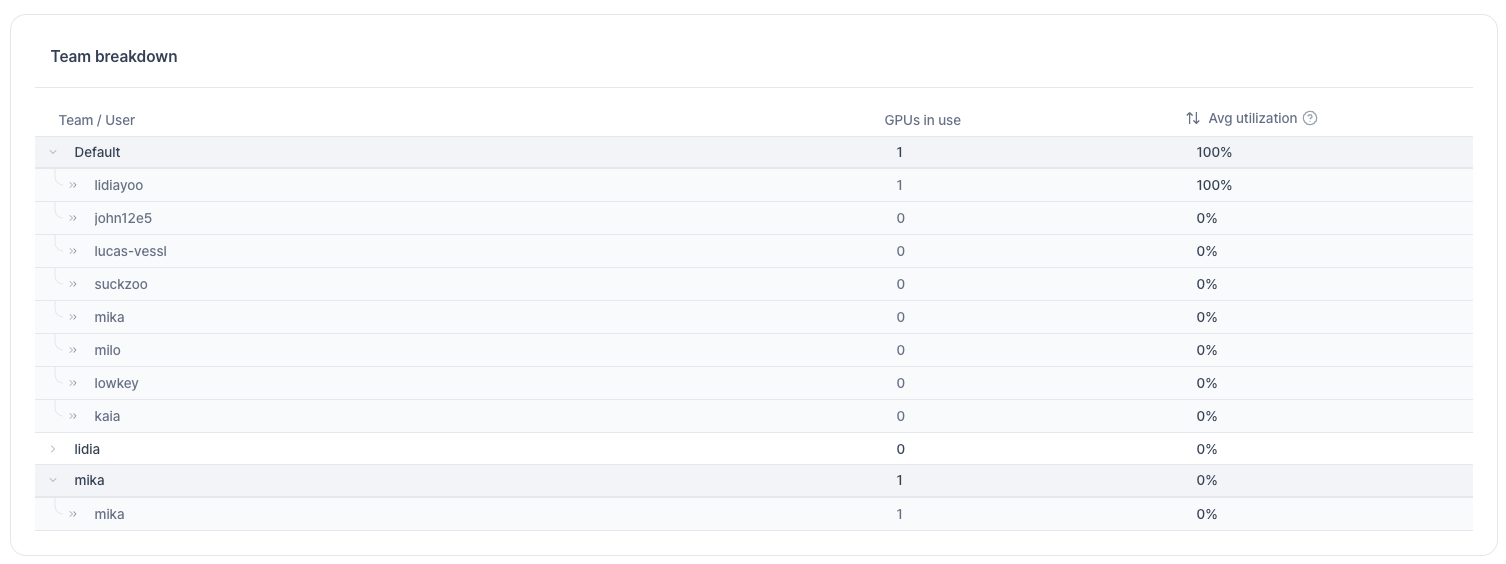
Team Breakdown Table
The Team Breakdown table gives admins a per-team view of GPU usage:
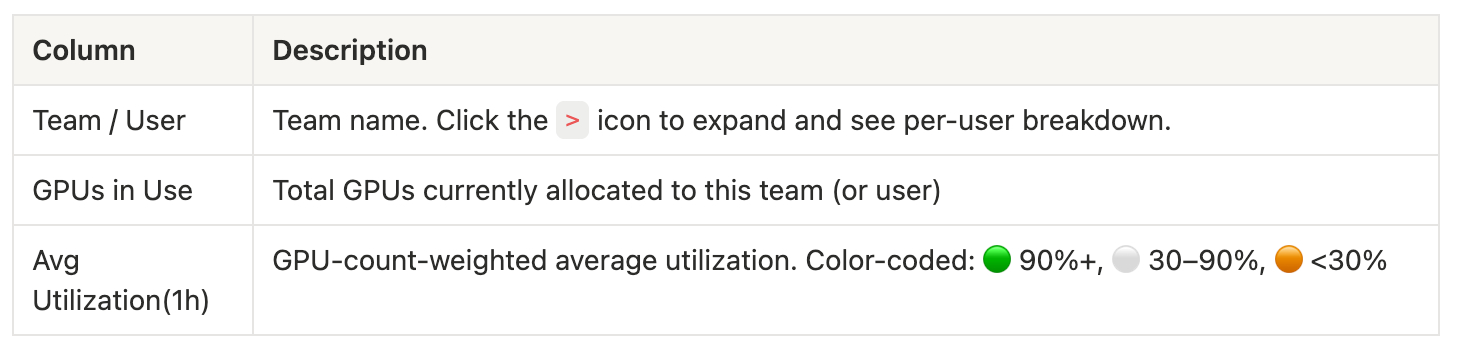
Click any team row to drill down and see individual user-level utilization within that team.
Workload Table
The full workload table lets admins filter by team, user, or idle-only status. Each row shows:
- Workload Name, Team, User
- GPU — Type and count
- GPU Utilization (1hr) — Average over the last hour
- VRAM Usage — Current video memory consumption
- Runtime — How long this workload has been running
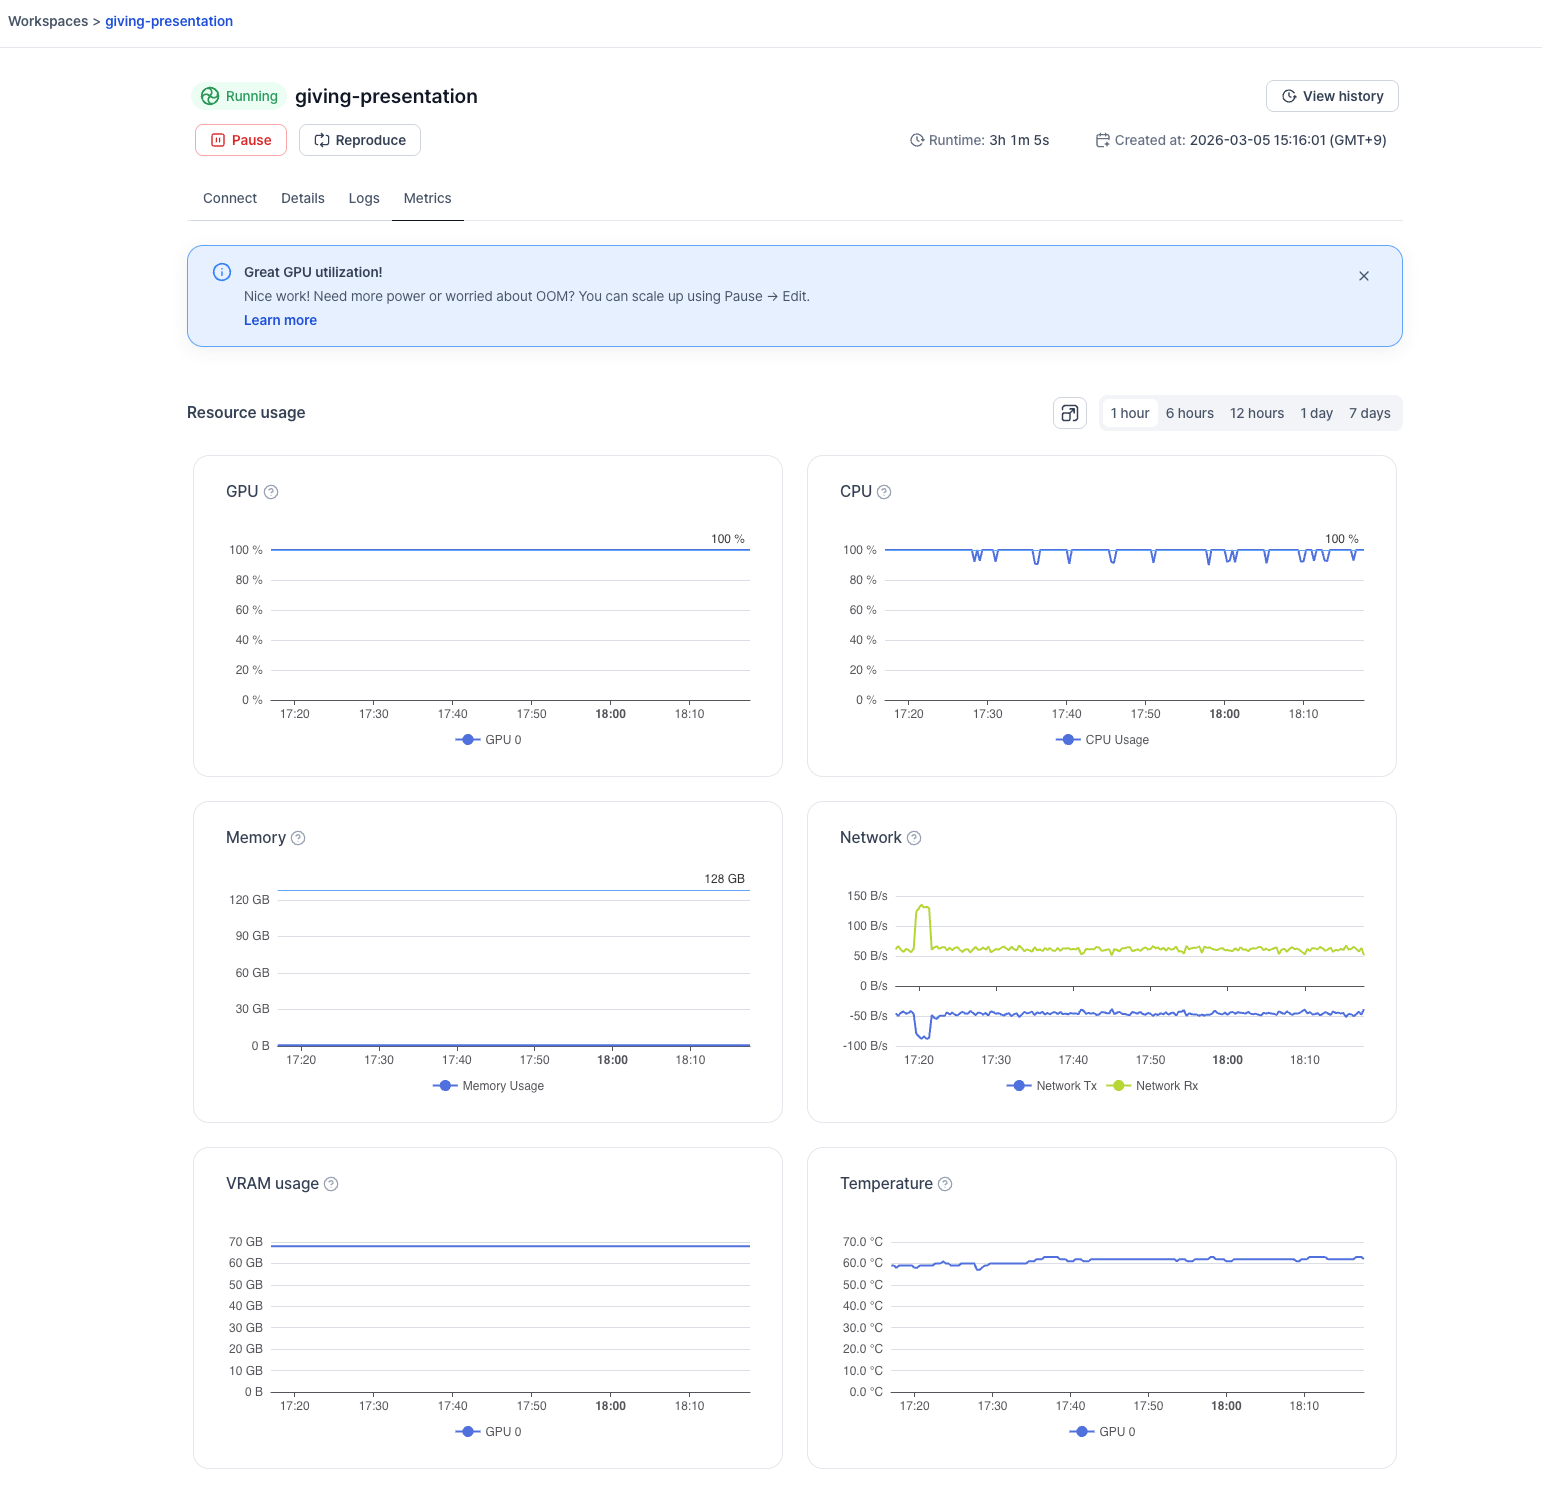
Workspace Metrics — Deeper Visibility
The Workspace Metrics page (accessible from any workspace's detail view → Metrics tab) has been updated with two new charts, an improved time range selector, and contextual banners.
New Charts & Filters
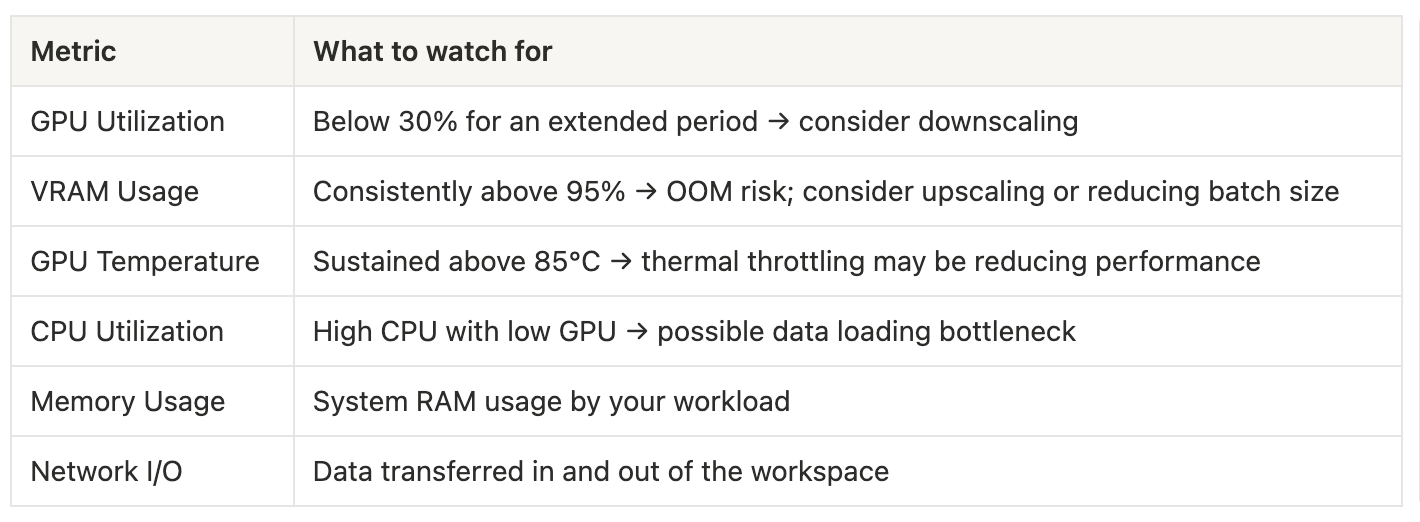
- VRAM Usage — See how much video memory your workload is consuming over time. Sustained usage above 95% is a signal that an OOM error may be imminent.
- GPU Temperature — Monitor GPU temperature over time. Temperatures consistently above 85°C can indicate thermal throttling, which silently reduces your compute performance.
- Time Range Filter — Choose from 1h, 6h, 12h, 1d, or 7d to zoom in or out on your metrics.
- Layout Toggle — Switch between grid view (2 charts per row) and expanded view (1 chart per row) for easier reading.
Reading the Charts
Contextual Banners
When you arrive at the Metrics page, a banner appears at the top based on the workload's GPU utilization state.
Low utilization (GPU Util < 30%)
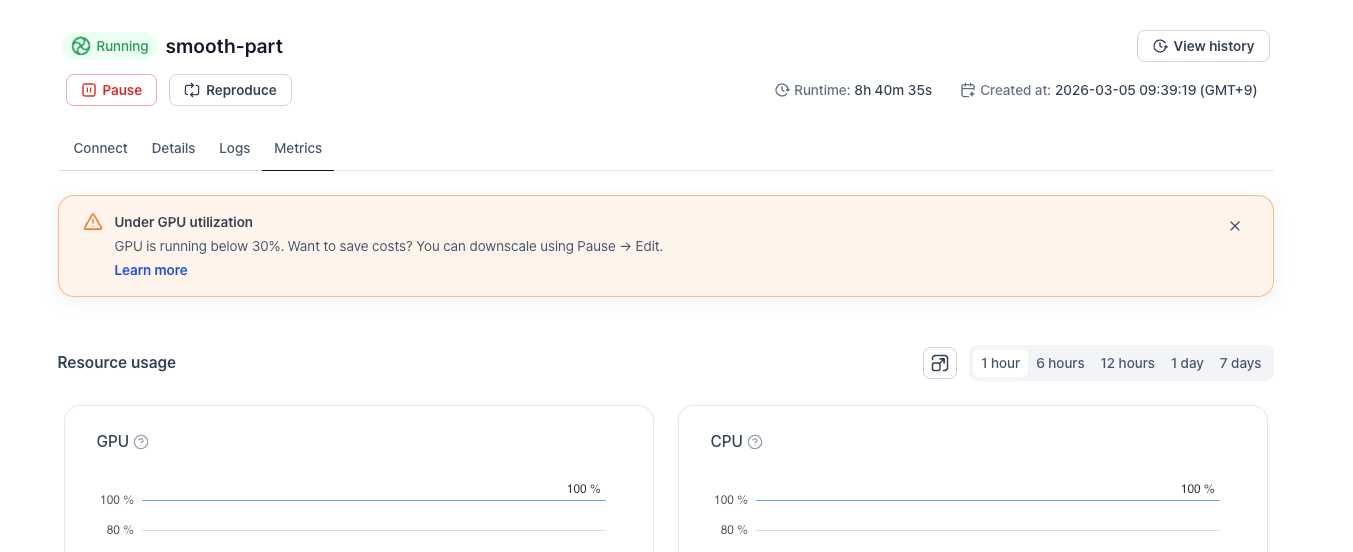
Low GPU utilization — GPU is running below 30%. Want to save costs? You can downscale using Pause → Edit.
High utilization (GPU Util > 90%)
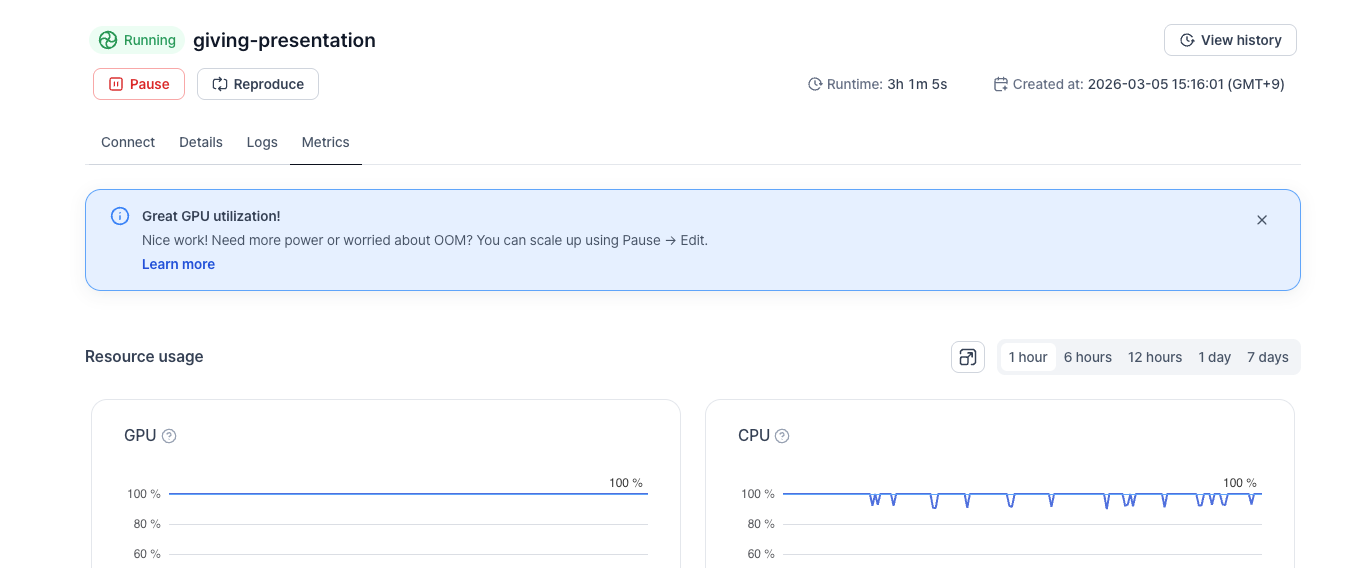
Great GPU utilization! Need more power or worried about OOM? You can scale up using Pause → Edit.
Where to Find the Dashboard
- Home Dashboard: Navigate to Home in the left sidebar after logging in.
- Org Dashboard: Go to Manage > Organization > Dashboard (visible to org admins only).
- Workspace Metrics: Open any workspace → click the Metrics tab.
To Conclude
The Dashboard brings together GPU utilization, VRAM, temperature, cost, and team-level usage into surfaces designed for your role — whether you're an engineer debugging a training run or an admin allocating resources across teams.
Ready to take a look? Log in and head to Home in the left sidebar to get started.
We'd love your feedback. If you have questions or suggestions, reach out to us at support@vessl.ai.
Happy training! 🚀
FAQ
Can I check GPU utilization and cost in real time from the VESSL Cloud Dashboard?
Yes. The VESSL Cloud Home Dashboard shows running workloads, GPU utilization, VRAM, and hourly spend in one place. After you log in, open Home in the left sidebar to review the summary cards and workload table.
Can the dashboard automatically detect idle workloads with low GPU utilization?
Yes. The Home Dashboard visually flags workloads with low GPU utilization over the last hour, and the Organization Dashboard surfaces workloads that stayed at 0% GPU utilization for the last three hours. Admins can use Review to jump directly to the filtered idle-workload list.
How can I compare team-level GPU cost and utilization across the organization?
Open Manage > Organization > Dashboard to view the spend trend chart and the team breakdown table. You can compare team-level GPU usage, see which teams are spending the most, and spot underutilized workloads more quickly.
What happens when VRAM usage stays high, and how should I respond?
If VRAM usage stays above 95%, your workload may be close to an out-of-memory error. Watch VRAM in the workspace Metrics tab, and if needed, scale up the GPU or reduce the batch size before the run fails.
What is the performance impact of high GPU temperature?
If GPU temperature stays above 85°C, thermal throttling can reduce performance. The workspace Metrics tab lets you monitor GPU temperature over time so you can investigate sustained heat before it silently slows your workload.
VESSL AI
Subscribe to our newsletter
Monthly insights on building AI infrastructure, the latest GPU news, and more.